Engine Profiler Support
Currently, DJL supports experimental profilers for developers that investigate the performance of operator execution as well as memory consumption. The profilers are from engines directly and DJL just expose them. So different engines have different APIs and produce different output format. We are still working in progress on the feature. In the future, we are considering to design a unified APIs and output unified format.
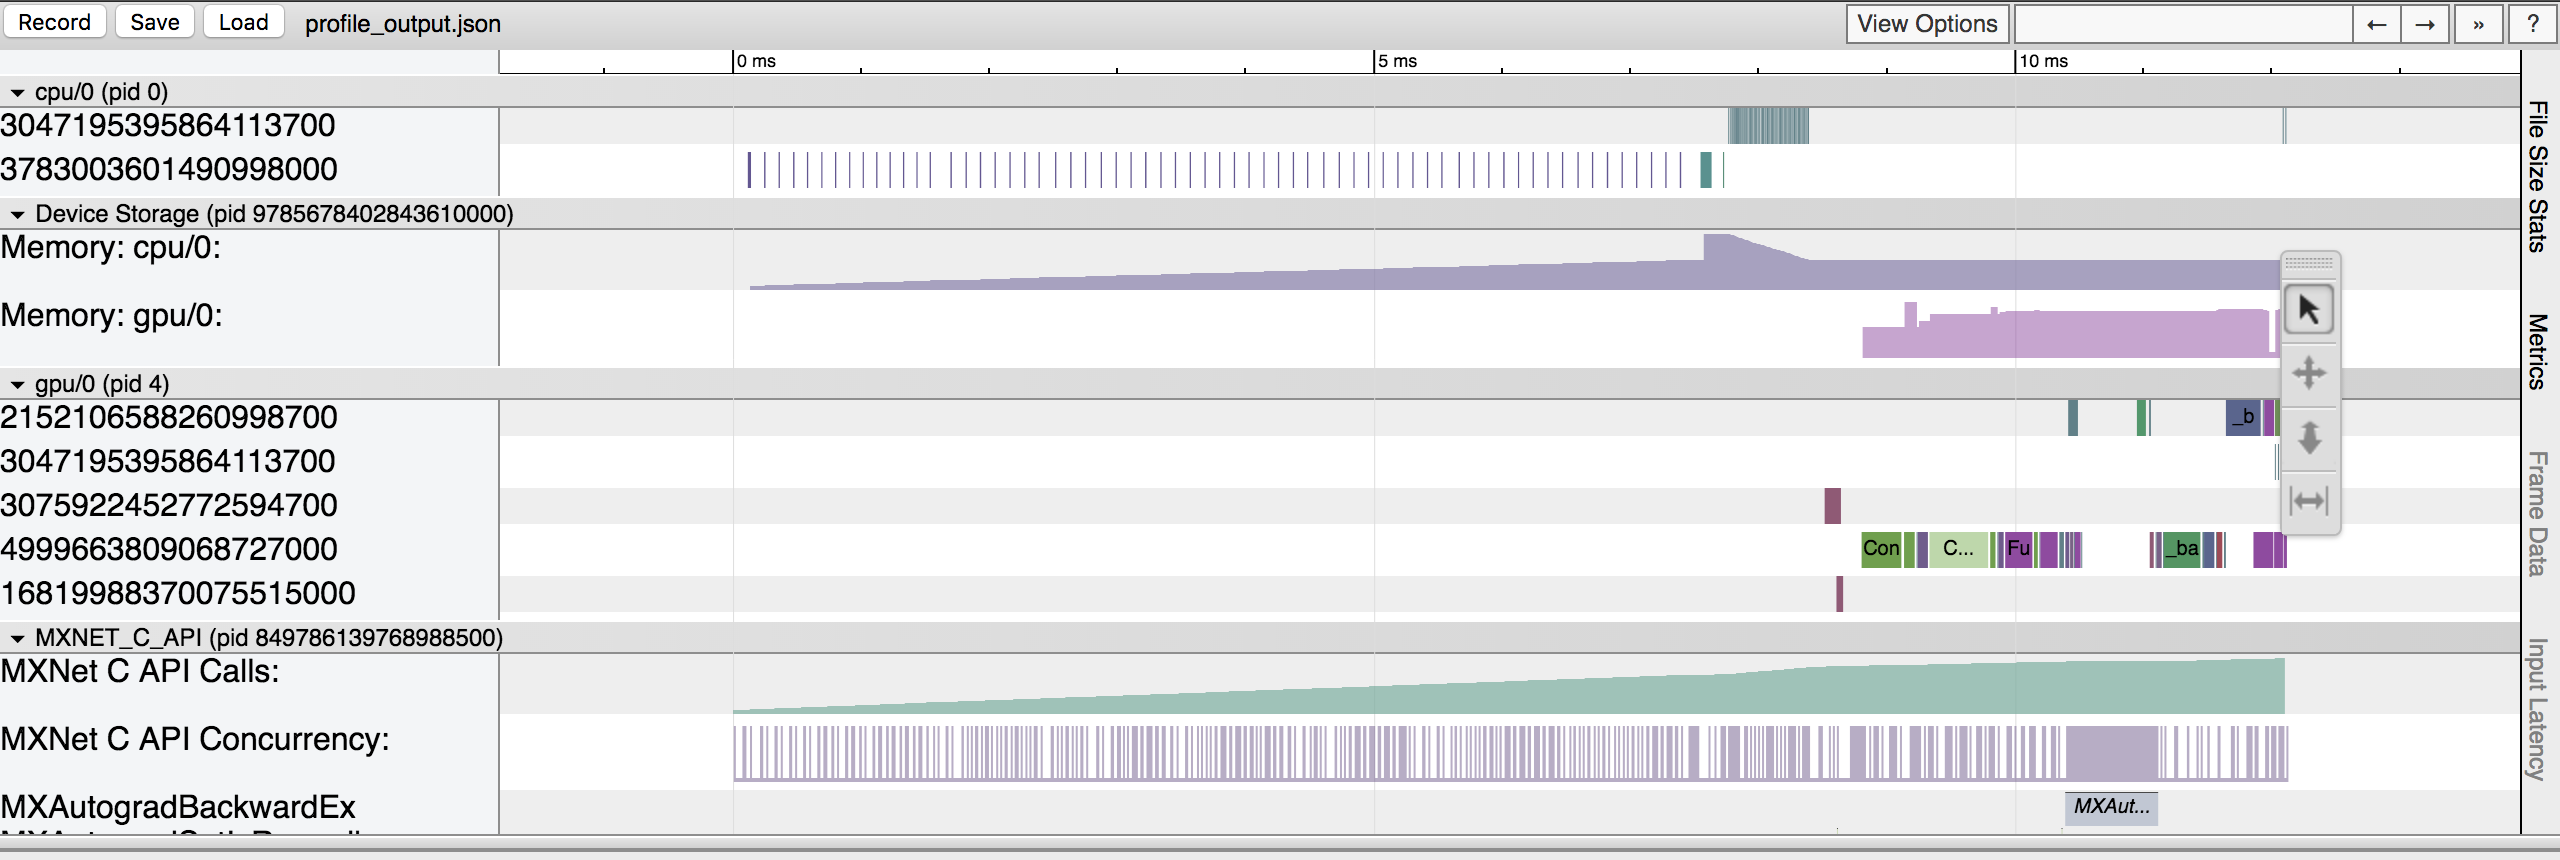
MXNet
By setting the following environment variable, it generates profile.json after executing the code.
export MXNET_PROFILER_AUTOSTART=1
You can view it in a browser using trace consumer like chrome://tracing. Here is a snapshot that shows the sample output.
PyTorch
DJL have integrated PyTorch C++ profiler API and expose JniUtils.startProfile and JniUtils.stopProfile(outputFile) Java APIs.
JniUtils.startProfile takes useCuda(boolean), recordShape(boolean) and profileMemory(boolean) arguments respectively.
useCuda indicates if profiler enables timing of CUDA events using the cudaEvent API.
recordShape indicates if information about input dimensions will be collected or not.
profileMemory indicates if profiler report memory usage or not.
JniUtils.stopProfile takes a outputFile of String type.
Wrap the code snippet you want to profile in between JniUtils.startProfile and JniUtils.stopProfile.
Here is an example.
try (ZooModel<Image, Classifications> model = criteria.loadModel()) {
    try (Predictor<Image, Classifications> predictor = model.newPredictor()) {
        Image image = ImageFactory.getInstance()
                        .fromNDArray(manager.zeros(new Shape(3, 224, 224), DataType.UINT8));

        JniUtils.startProfile(false, true, true);
        predictor.predict(image);
        JniUtils.stopProfile(outputFile);
    } catch (TranslateException e) {
        e.printStackTrace();
}
The output format is composed of operator execution record.
Each record contains name(operator name), dur(time duration), shape(input shapes), cpu mem(cpu memory footprint).
{
  "name": "aten::empty",
  "ph": "X",
  "ts": 24528.313000,
  "dur": 5.246000,
  "tid": 1,
  "pid": "CPU Functions",
  "shape": [[], [], [], [], [], []],
  "cpu mem": "0 b",
  "args": {}
}
OnnxRuntime
When loading a model, the profiler can be enabled by specifying the desired filepath in the criteria:
    Criteria<Image, Classifications> criteria =
        Criteria.builder()
            .optOption("profilerOutput", "build/testOrtProfiling")
            ...
            .build()
Following this, the file will appear at "build/tesetOrtProfiling_YYYY-MM-DD.json".
You can view it in a browser using a trace consumer like chrome://tracing.
For more details, see the OnnxRuntime Profiler Docs.